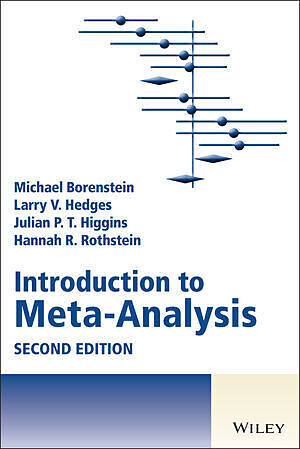

Introduction to Meta-Analysis
Beschreibung
This book provides a clear and thorough introduction to meta-analysis, the process of synthesizing data from a series of separate studies. The first edition of this text was widely acclaimed for the clarity of the presentation, and quickly established itself a...Format auswählen
- Fester EinbandCHF 98.80
Wird oft zusammen gekauft
Andere Kunden kauften auch
Beschreibung
This book provides a clear and thorough introduction to meta-analysis, the process of synthesizing data from a series of separate studies. The first edition of this text was widely acclaimed for the clarity of the presentation, and quickly established itself as the definitive text in this field. The fully updated second edition includes new and expanded content on avoiding common mistakes in meta-analysis, understanding heterogeneity in effects, publication bias, and more. Several brand-new chapters provide a systematic "how to" approach to performing and reporting a meta-analysis from start to finish.
Written by four of the world's foremost authorities on all aspects of meta-analysis, the new edition:
- Outlines the role of meta-analysis in the research process
- Shows how to compute effects sizes and treatment effects
- Explains the fixed-effect and random-effects models for synthesizing data
- Demonstrates how to assess and interpret variation in effect size across studies
- Explains how to avoid common mistakes in meta-analysis
- Discusses controversies in meta-analysis
Includes access to a companion website containing videos, spreadsheets, data files, free software for prediction intervals, and step-by-step instructions for performing analyses using Comprehensive Meta-Analysis (CMA)(TM)
Download videos, class materials, and worked examples at www.Introduction-to-Meta-Analysis.com
Autorentext
Michael Borenstein is the Director of Biostat, a leading developer of statistical software. He is the primary developer of Comprehensive Meta-Analysis (CMA), the world's most widely used program for meta-analysis. He is the recipient of numerous grants from the NIH to develop methods, software, and educational materials for meta-analysis. He has lectured widely on meta-analysis, including at the NIH, CDC, and FDA. Larry V. Hedges is Board of Trustees Professor of Statistics and Education and Social Policy, Professor of Psychology, Professor of Medical Social Sciences, and IPR Fellow, Northwestern University, USA. He is a national leader in the fields of educational statistics and evaluation and is an elected member of many leading associations. Julian P.T. Higgins is Professor of Evidence Synthesis at the University of Bristol, UK, and a National Institute for Health Research (NIHR) Senior Investigator. He has had numerous core roles in the Cochrane Collaboration, including editing its methodological Handbook since 2003. His many contributions to meta-analysis include the foundation of network meta-analysis, methods for describing and explaining heterogeneity and a general framework for individual participant data meta-analysis. He is a Highly Cited Researcher with over a quarter of a million citations to his work and has been a recipient of the Ingram Olkin Award for distinguished lifetime achievement in research synthesis methodology. Hannah R. Rothstein is Professor of Management at Baruch College and the Graduate Center of the City University of New York. She is a Fellow of the American Psychological Association and a past President of the Society for Research Synthesis Methodology. She is former Editor-in-Chief of Research Synthesis Methods and serves on the editorial boards of Psychological Bulletin, Psychological Methods, and Organizational Research Methods. Professor Rothstein is a co-developer of the Comprehensive Meta-Analysis software and has published numerous systematic reviews and meta-analyses.Inhalt
List of Tables xv
List of Figures xix
Acknowledgements xxv
Preface xxvii
Preface to the Second Edition xxxv
Website xxxvii
Part 1: Introduction
1 How a Meta-Analysis Works 3
2 Why Perform a Meta-Analysis 9
Part 2: Effect Size and Precision
3 Overview 17
4 Effect Sizes Based On Means 21
5 Effect Sizes Based On Binary Data (2 × 2 Tables) 33
6 Effect Sizes Based On Correlations 39
7 Converting Among Effect Sizes 43
8 Factors That Affect Precision 49
9 Concluding Remarks 55
Part 3: Fixed-Effect Versus Random-Effects Models
10 Overview 59
11 Fixed-Effect Model 61
12 Random-Effects Model 65
13 Fixed-Effect Versus Random-Effects Models 71
14 Worked Examples (Part 1) 81
Part 4: Heterogeneity
15 Overview 97
16 Identifying and Quantifying Heterogeneity 99
17 Prediction Intervals 119
18 Worked Examples (Part 2) 127
19 An Intuitive Look At Heterogeneity 139
20 Classifying Heterogeneity As Low, Moderate, Or High 155
Part 5: Explaining Heterogeneity
21 Subgroup Analyses 161
22 Meta-Regression 197
23 Notes On Subgroup Analyses and Meta-Regression 213
Part 6: Putting It All In Context
24 Looking At the Whole Picture 223
25 Limitations of the Random-Effects Model 233
26 Knapp-Hartung Adjustment 243
Part 7: Complex Data Structures
27 Overview 253
28 Independent Subgroups Within a Study 255
29 Multiple Outcomes or Time-Points Within A Study 263
30 Multiple Comparisons Within a Study 277
31 Notes On Complex Data Structures 281
Part 8: Other Issues
32 Overview 287
33 Vote Counting - A New Name For An Old Problem 289
34 Power Analysis For Meta-Analysis 295
35 Publication Bias 313
Part 9: Issues Related To Effect Size
36 Overview 335
37 Effect Sizes Rather Than P-Values 337
38 Simpson's Paradox 343
39 Generality of the Basic Inverse-Variance Method 349
Part 10: Further Methods
40 Overview 361
41 Meta-Analysis Methods Based On Direction and P-Values 363
42 Further Methods For Dichotomous Data 369
43 Psychometric Meta-Analysis 377
Part 11: Meta-Analysis In Context
44 Overview 391
45 When Does It Make Sense To Perform a Meta-Analysis? 393
46 Reporting The Results of a Meta-Analysis 401
47 Cumulative Meta-Analysis 407
48 Criticisms of Meta-Analysis 413
49 Comprehensive Meta-Analysis Software 425
50 How To Explain the Results of An Analysis 443
Part 12: Resources
51 Software For Meta-Analysis 471
52 Web Sites, Societies, Journals, and Books 473
Web sites 473
Professional societies 476
Journals 476
Special issues dedicated to meta-analysis 477
Books on systematic review methods and meta-analysis 477
References 479
Index 491